前言
众所周知,对数几率回归,也就是Logistic回归,对于机器学习初学者来说是重要的基础,也是从小白走向大神的第一步。借着学校机器学习课的机会,我也开始尝试啃了啃西瓜书,下面这个例子就是基于自西瓜书课后习题,watermelon3.0alpha数据集进行的对数几率回归。
本文将使用两种方法,牛顿法和梯度下降法分别实现回归过程,从而形成一定的对比。
算法原理推导
对数几率回归原理推导
首先,为实现二分类任务,使用sigmoid函数对线性回归进行激活,sigmoid函数如下:
y = \frac{1}{1+e^{-z}}
其中,z为线性回归的表示形式,即z = \theta^Tx+b
与线性回归中常用的均方误差(MSE)不同,对数几率回归其损失函数的形式为:
\begin{aligned}
Loss(\theta,b) =& -[y\times\log\hat{y} + (1-y)\times\log(1-\hat{y})]\\
=& -[y\times\log{\frac{1}{1+e^{-z}}} + (1-y)\times\log(1-\frac{1}{1+e^{-z}})]\\
=& -[-y\log(1+e^{-z}) + (1-y)\log(\frac{e^{-z}}{1+e^{-z}})]\\
=& -[-y\log(1+e^{-z})+\log(\frac{e^{-z}}{1+e^{-z}})-y\log(\frac{e^{-z}}{1+e^{-z}})]\\
=& -[-y\log(1+e^{-z})+\log(\frac{1}{e^{z}+1})-y\log(e^{-z})+y\log(1+e^{-z})]\\
=& \quad y\times z + \log(e^z+1)
\end{aligned}
至此,我们的问题转化为优化上述损失函数,使得其值最小,分别使用梯度下降法和牛顿法优化上述损失函数:
梯度下降法
在数据格式化处理阶段,将参数b与\theta放在同一个矩阵内进行运算,因此,梯度下降的迭代过程可以表示为:
\theta = \theta – \alpha\frac{\partial L}{\partial \theta}
其中\alpha为人工指定的学习率,\frac{\partial L}{\partial \theta}由下述方式求得:
\begin{align}
\frac{\partial L}{\partial \theta} =& \frac{\partial L}{\partial z}\frac{\partial z}{\partial \theta} \\
=& \frac{\partial L}{\partial \hat{y}}\frac{\partial \hat{y}}{\partial z}\frac{\partial z}{\partial \theta}\\
\end{align}
因此,分别对\frac{\partial L}{\partial \hat{y}},\frac{\partial \hat{y}}{\partial z},\frac{\partial z}{\partial \theta}进行求解:
\frac{\partial L}{\partial \hat{y}} = \frac{\hat{y}-y}{\hat{y}(1-\hat{y})}
\begin{align}
\frac{\partial \hat{y}}{\partial z}=&(\frac{1}{1+e^{-z}})^{‘}\\
=&\frac{e^{-z}}{(1+e^{-z})^2} = \frac{1+e^{-z}-1}{(1+e^{-z})^2}\\
=&\frac{1}{(1+e^{-z})}-\frac{1}{(1+e^{-z})^2}\\
=& \hat{y} – \hat{y}^2\\
=& \hat{y}(1-\hat{y})
\end{align}
这一步其实是很关键的,看似复杂的sigmoid函数,对其求导后的结果竟然变成\hat{y}(1-\hat{y}),这也是很多人在没有手动推导公式的情况下看到这个时感到不理解的原因(比如我)。
\frac{\partial z}{\partial \theta} = x
综上可得,\frac{\partial L}{\partial \theta} = (\hat{y}-y)x,即参数\theta的更新方式为:
\theta = \theta – \alpha (\hat{y}-y)x
牛顿法
在牛顿法中,其标准形式的向量参数\theta的更新迭代过程可表示为:
\theta = \theta – H(L)^{-1}\frac{\partial L}{\partial \theta}
其中H(\theta)为二阶导数\frac{\partial^2 L}{\partial \theta^2}矩阵,即Hession矩阵,其构造方法为:
\frac{\partial^2 L}{\partial \theta^2}=X diag \{(1-\hat{y})\hat y\}_{m,m}X^T
为什么会有这样一个看起来很奇怪的构造方法呢,在我的理解中,与Hession矩阵的形式有关,众所周知,Hession矩阵长这个样子:
H(L)= \begin{Bmatrix} \frac{\partial^2 L}{\partial \theta_1^2}&\frac{\partial^2 L}{\partial \theta_1\theta_2}&\cdots&\frac{\partial^2 L}{\partial \theta_1\theta_n}\\ \frac{\partial^2 L}{\partial \theta_2\theta_1}&\frac{\partial^2 L}{\partial \theta_2^2}&\cdots&\frac{\partial^2 L}{\partial \theta_2\theta_n} \\ \vdots&\vdots&\ddots&\vdots \\ \frac{\partial^2 L}{\partial \theta_n\theta_1}&\frac{\partial^2 L}{\partial \theta_n\theta_2}&\cdots&\frac{\partial^2 L}{\partial \theta_n^2} \end{Bmatrix}
又根据上述过程中求出的\frac{\partial L}{\partial \theta} = (\hat{y}-y)x可知,最基本基础的二阶偏导为:
\frac{\partial^2 L}{\partial \theta^2} = x\times y(1-y)\times x
因此使用diag\{(1-\hat{y})\hat{y}\}_{m,m}构建对角矩阵,再分别左乘X,右乘X^T,利用矩阵运算的方式代替求和过程,求出Hession矩阵。
依据该过程进行迭代,直到两次迭代产生的损失函数差值小于10^{-5}
算法的实现
Logistic_Regression函数
|
1 2 3 4 5 6 7 8 9 10 11 12 13 14 15 |
def Logistic_Regression(alpha=0.05, num_iters=800): (X_train, Y_train) = read_data() # 读入数据 m = X_train.shape[0] # 获取数据组数 col = X_train.shape[1] # 获取参数列数 X_train = np.hstack((np.ones((m, 1)), X_train)) # print(Y_train) theta1 = np.zeros((col+1, 1)) theta2 = np.zeros((col+1, 1)) Y_train = Y_train.reshape(-1, 1) theta1 = Gradient_Descent(X_train, Y_train, theta1, alpha, num_iters) theta2 = Newtown(X_train, Y_train, theta2) print("梯度下降法所得参数theta为:", theta1) print("牛顿法所得参数theta为:", theta2) |
首先利用read_data()函数读入训练集数据,并构造两个theta矩阵,分别代表两种方式求得的\theta值
分别调用Gradient_Descent()函数和Newtown()函数求解参数值并输出结果。
Gradient_Descent()函数
|
1 2 3 4 5 6 7 8 9 10 |
def Gradient_Descent(X_train, Y_train, theta, alpha, num_iters): for i in range(num_iters): h = np.dot(X_train, theta) # wx+b p = 1.0 / (1.0 + np.exp(-h)) # sigmoid(wx+b) temp = np.dot(np.transpose(X_train), (p - Y_train)) # 一阶导数 theta -= temp * alpha # 梯度下降 result_plot(X_train, Y_train, theta) return theta |
该函数接收训练集,参数,学习率,训练次数作为其参数,在每一轮训练中,首先利用np.dot()函数计算h值,即z=\theta x+b的值,再将其带入sigmoid函数,存入p中。依据上述原理推导中的迭代公式,求解一阶导数并不断进行梯度下降过程。
完成梯度下降后,进行数据可视化处理。
Newtown()函数
|
1 2 3 4 5 6 7 8 9 10 11 12 13 14 15 16 17 18 19 |
def Newtown(X_train, Y_train, theta): m = X_train.shape[0] h = np.dot(X_train, theta) pre_cost = 0 now_cost = np.sum(-Y_train*h + np.log(np.exp(h)+1)) # 上式化简结果 iters = 0 while np.abs(now_cost - pre_cost) > 1e-5: p = 1.0 / (1.0 + np.exp(-h)) diag = np.diag((p * (1-p)).reshape(m)) # 转换成对角矩阵 temp1 = np.dot(np.transpose(X_train), (p - Y_train)) # 一阶导数 temp2 = np.dot(np.dot(np.transpose(X_train), diag), X_train) # 二阶导数,hessian矩阵 theta -= np.transpose(np.transpose(temp1).dot(np.linalg.inv(temp2))) # 转换维度,迭代theta h = np.dot(X_train, theta) pre_cost = now_cost now_cost = np.sum(-Y_train * h + np.log(np.exp(h) + 1)) iters += 1 result_plot(X_train, Y_train, theta) return theta |
与梯度下降过程类似,对于每一次迭代过程,求解一阶导数temp1,利用np.diag()函数构建对角矩阵,并将其二阶导数矩阵存入temp2中,依据上述原理推导公式进行迭代。
完成牛顿法后,进行数据可视化处理。
结果可视化
- 梯度下降法
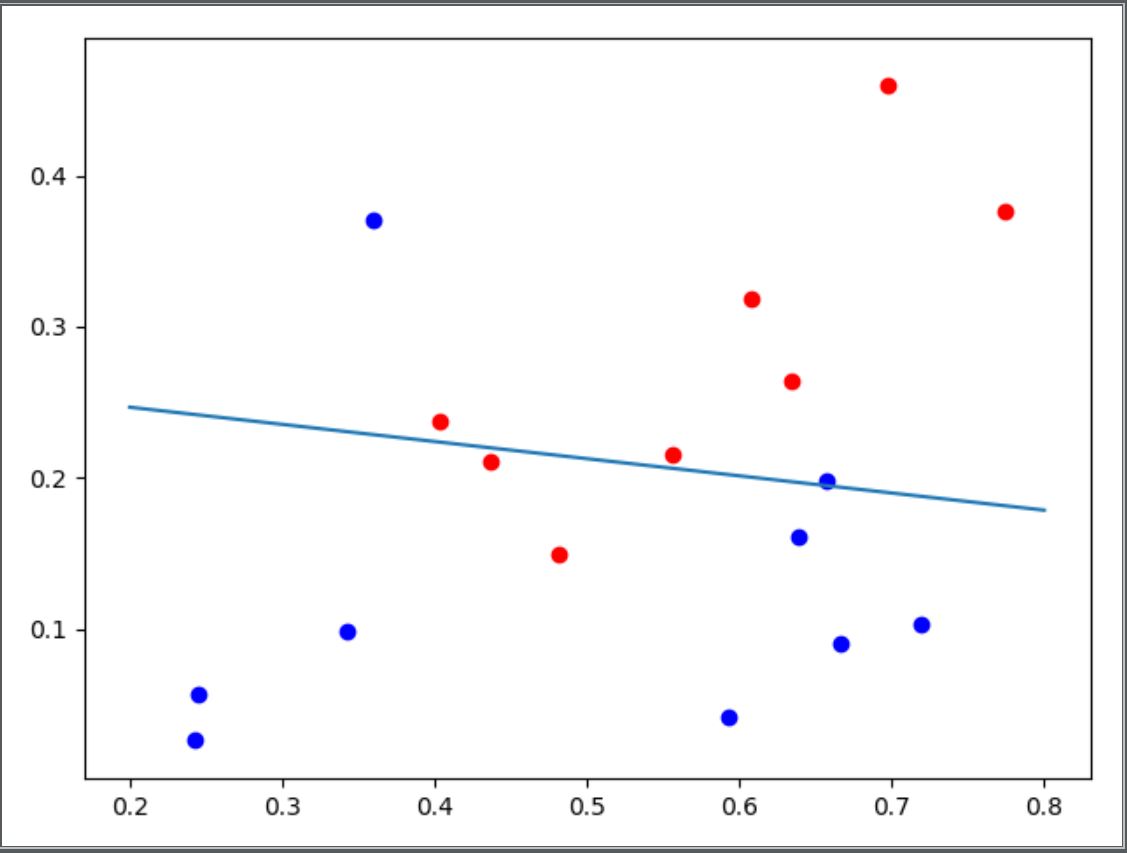
在学习率为0.05,训练次数800次的条件下,得到的\theta的取值为[[-2.68912184], [ 1.13236467], [ 9.97918983]],对其分类效果进行可视化处理如下图:

-
牛顿法
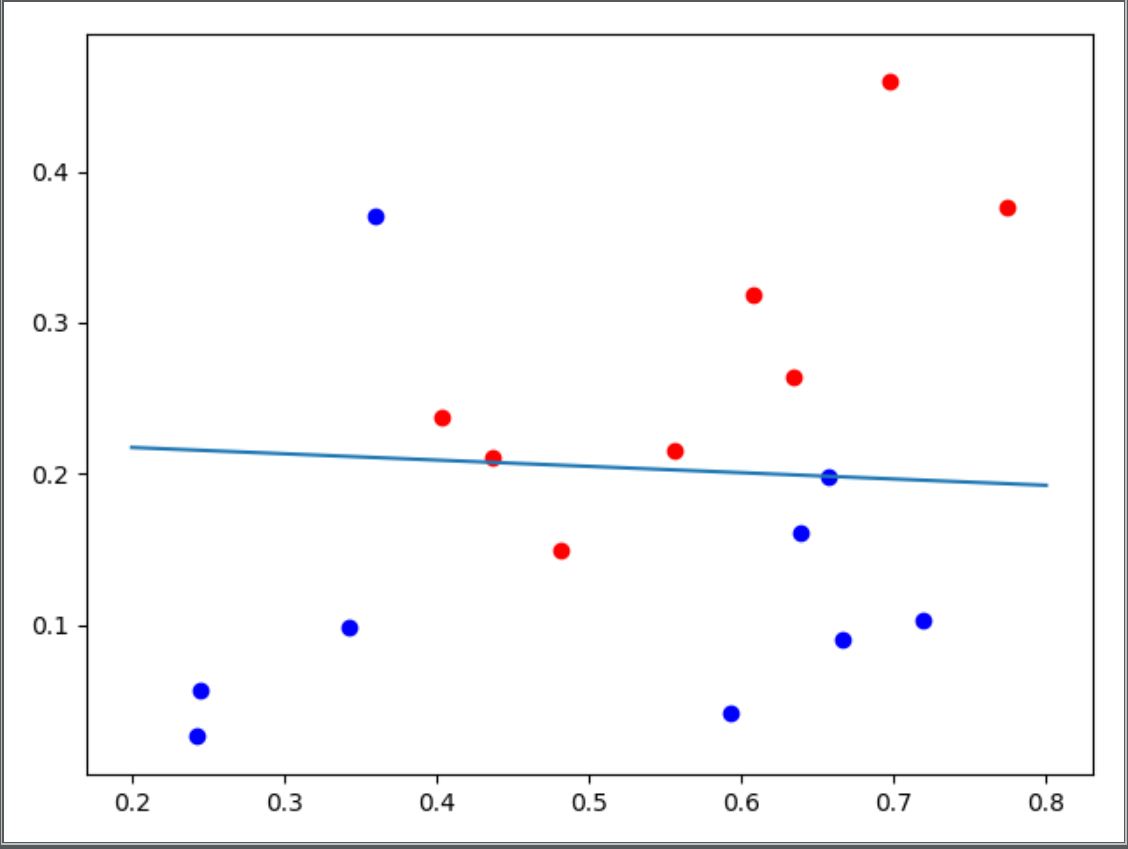
当两次迭代之间的误差小于10^{-5}时,其迭代次数为5次,得到的\theta的取值为[[-3.2642666 ],[ 0.60313065], [14.45233445]],对其分类效果进行可视化处理如下图:

源代码
|
1 2 3 4 5 6 7 8 9 10 11 12 13 14 15 16 17 18 19 20 21 22 23 24 25 26 27 28 29 30 31 32 33 34 35 36 37 38 39 40 41 42 43 44 45 46 47 48 49 50 51 52 53 54 55 56 57 58 59 60 61 62 63 64 65 66 67 68 69 70 71 72 73 74 75 76 77 78 79 80 81 82 83 84 85 86 |
import numpy as np import matplotlib.pyplot as plt def read_data(): X_train = np.loadtxt("data/homework1/watermelon3.0alpha.csv", delimiter=",", usecols=(1, 2)) Y_train = np.loadtxt("data/homework1/watermelon3.0alpha.csv", delimiter=",", usecols=3) # print(X_train.shape) # print(Y_train.shape) return X_train, Y_train def result_plot(x, y, w_min): # 结果可视化 x1 = np.arange(0.2, 0.8, 0.01) y1 = [-(w_min[0] + w_min[1] * x1[k]) / w_min[2] for k in range(len(x1))] # 利用参数构造函数图像 for i in range(len(y)): if y[i] == 1: plt.scatter(x[i][1], x[i][2], c='r') else: plt.scatter(x[i][1], x[i][2], c='b') plt.plot(x1, y1) plt.show() def Gradient_Descent(X_train, Y_train, theta, alpha, num_iters): for i in range(num_iters): h = np.dot(X_train, theta) # wx+b p = 1.0 / (1.0 + np.exp(-h)) # sigmoid(wx+b) # temp = -np.sum(X_train * (Y_train - p1), 0, keepdims=True) temp = np.dot(np.transpose(X_train), (p - Y_train)) # 一阶导数 theta -= temp * alpha # 梯度下降 # h = np.dot(X_train, theta) # p = 1.0 / (1.0 + np.exp(-h)) # for i in range(len(p1)): # if p[i] >= 0.5: # p[i] = 1 # else: # p[i] = 0 # print(p) result_plot(X_train, Y_train, theta) return theta def Newtown(X_train, Y_train, theta): m = X_train.shape[0] h = np.dot(X_train, theta) pre_cost = 0 # now_cost = -np.sum(Y_train*np.log(h) + (1-Y_train)*np.log(1-h)) now_cost = np.sum(-Y_train*h + np.log(np.exp(h)+1)) # 上式化简结果 iters = 0 while np.abs(now_cost - pre_cost) > 1e-5: p = 1.0 / (1.0 + np.exp(-h)) diag = np.diag((p * (1-p)).reshape(m)) # 转换成对角矩阵 temp1 = np.dot(np.transpose(X_train), (p - Y_train)) # 一阶导数 temp2 = np.dot(np.dot(np.transpose(X_train), diag), X_train) # 二阶导数,hessian矩阵 theta -= np.transpose(np.transpose(temp1).dot(np.linalg.inv(temp2))) # 转换维度,迭代theta # print(((temp1.T).dot(np.linalg.inv(temp2))).shape) h = np.dot(X_train, theta) pre_cost = now_cost # 更新旧损失函数 now_cost = np.sum(-Y_train * h + np.log(np.exp(h) + 1)) # 计算新损失函数 iters += 1 # print("轮数 = ", iters) # print(theta) result_plot(X_train, Y_train, theta) return theta def Logistic_Regression(alpha=0.05, num_iters=800): (X_train, Y_train) = read_data() # 读入数据 m = X_train.shape[0] # 获取数据组数 col = X_train.shape[1] # 获取参数列数 X_train = np.hstack((np.ones((m, 1)), X_train)) Y_train = Y_train.reshape(-1, 1) # print(Y_train) theta1 = np.zeros((col+1, 1)) theta2 = np.zeros((col+1, 1)) theta1 = Gradient_Descent(X_train, Y_train, theta1, alpha, num_iters) theta2 = Newtown(X_train, Y_train, theta2) print("梯度下降法所得参数theta为:", theta1) print("牛顿法所得参数theta为:", theta2) if __name__ == "__main__": Logistic_Regression() |

《牛顿法和梯度下降法实现对数几率回归》有2个想法
bb好厉害
Moss